Package epydoc :: Package docwriter :: Module dotgraph
[hide private]
[frames] | no frames]

Module dotgraph

source code

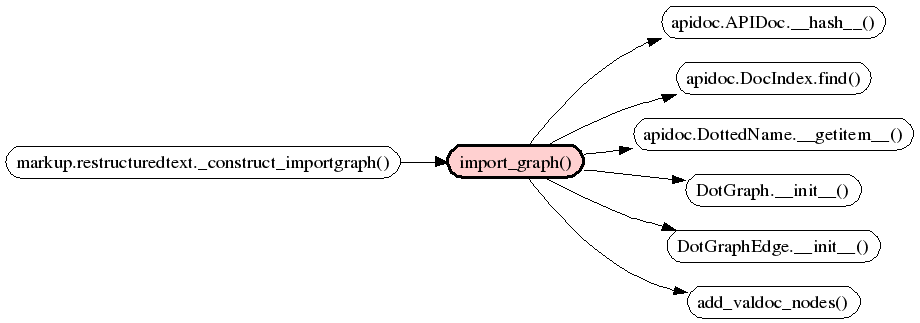
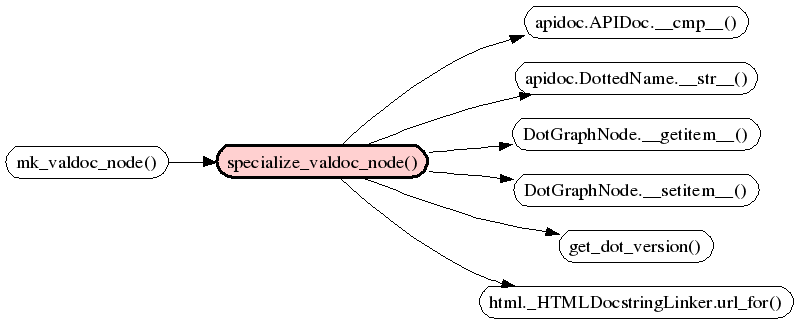
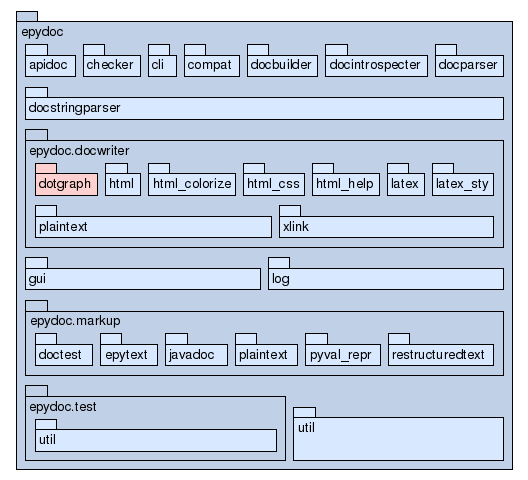
Render Graphviz directed graphs as images. Below are some examples.

Import Graph
Import Graph

Class Hierarchy for apidoc.APIDoc

Package Tree for epydoc


See Also: The Graphviz Homepage

Classes [hide private]
    Dot Graphs
DotGraph
A dot directed graph.
DotGraphNode
DotGraphEdge
    Specialized Nodes for UML Graphs
DotGraphUmlClassNode
A specialized dot graph node used to display ClassDocs using UML notation.
DotGraphUmlModuleNode
A specialized dot grah node used to display ModuleDocs using UML notation.
Functions [hide private]
    Graph Generation Functions
 
package_tree_graph(packages, linker, context=None, **options)
Return a DotGraph that graphically displays the package hierarchies for the given packages.
source code
call graph 
 
uml_package_tree_graph(packages, linker, context=None, **options)
Return a DotGraph that graphically displays the package hierarchies for the given packages as a nested set of UML symbols.
source code
call graph 
 
class_tree_graph(classes, linker, context=None, **options)
Return a DotGraph that graphically displays the class hierarchy for the given classes.
source code
call graph 
 
_class_tree_graph(graph, classes, mknode, mkedge, linker, context, options, cls2node)
A helper function that is used by both class\_tree\_graph() and uml\_class\_tree\_graph() to draw class trees.
source code
call graph 
 
_add_class_tree_superclasses(graph, classes, mknode, mkedge, linker, context, options, cls2node) source code
call graph 
 
_add_class_tree_subclasses(graph, classes, mknode, mkedge, linker, context, options, cls2node, truncated) source code
call graph 
 
_add_class_tree_inheritance(graph, classes, mknode, mkedge, linker, context, options, cls2node, truncated) source code
call graph 
 
_get_subclass_depth_map(classes) source code
call graph 
 
uml_class_tree_graph(classes, linker, context=None, **options)
Return a DotGraph that graphically displays the class hierarchy for the given class, using UML notation.
source code
call graph 
 
_uml_mknode(cls, nodetype, linker, context, options) source code
call graph 
 
_uml_mkedge(start, end, edgetype, options) source code
call graph 
 
import_graph(modules, docindex, linker, context=None, **options) source code
call graph 
 
call_graph(api_docs, docindex, linker, context=None, **options) source code
    Dot Version
 
get_dot_version() source code
call graph 
    Helper Functions
 
add_valdoc_nodes(graph, val_docs, linker, context) source code
call graph 
 
mk_valdoc_node(val_doc, linker, context) source code
call graph 
 
specialize_valdoc_node(node, val_doc, context, linker)
Update the style attributes of node to reflext its type and context.
source code
call graph 
 
name_list(api_docs, context=None) source code
call graph 
Variables [hide private]
  USE_DOT2TEX = False
Should the dot2tex module be used to render dot graphs to latex (if it's available)? This is experimental, and not yet working, so it should be left False for now.
  COLOR = {'BASECLASS_BG': '#e0b0a0', 'CLASS_BG': '#d8ffe8', 'IN...
colors for graphs of APIDocs
    Dot Graphs
  DOT_COMMAND = 'dot'
The command that should be used to spawn dot
    Dot Version
  _dot_version = None
  _DOT_VERSION_RE = re.compile(r'dot version ([\d\.]+)')
    Helper Functions
  NOOP_URL = 'javascript:void(0);'
  MODULE_NODE_HTML = '<TABLE BORDER="0" CELLBORDER="0" CELLSPACI...
Function Details [hide private]

class_tree_graph(classes, linker, context=None, **options)

source code 
call graph 

Return a DotGraph that graphically displays the class hierarchy for the given classes. Options:

  • exclude: A list of classes that should be excluded
  • dir: LR|RL|BT requests a left-to-right, right-to-left, or bottom-to- top, drawing. (corresponds to the dot option 'rankdir'
  • max_subclass_depth: The maximum depth to which subclasses will be drawn.
  • max_subclasses: A list of ints, specifying how many subclasses should be drawn per class at each level of the graph. E.g., [5,3,1] means draw up to 5 subclasses for the specified classes; up to 3 subsubclasses for each of those (up to) 5 subclasses; and up to 1 subclass for each of those.

_class_tree_graph(graph, classes, mknode, mkedge, linker, context, options, cls2node)

source code 
call graph 

A helper function that is used by both class\_tree\_graph() and uml\_class\_tree\_graph() to draw class trees. To abstract over the differences between the two, this function takes two callback functions that create graph nodes and edges:

  • mknode(base, nodetype, linker, context, options): Returns a DotGraphNode. nodetype is one of: subclass, superclass, selected, undocumented.
  • mkedge(begin, end, edgetype, options): Returns a DotGraphEdge. edgetype is one of: subclass, truncate-subclass.

uml_class_tree_graph(classes, linker, context=None, **options)

source code 
call graph 

Return a DotGraph that graphically displays the class hierarchy for the given class, using UML notation. Options:

  • exclude: A list of classes that should be excluded
  • dir: LR|RL|BT requests a left-to-right, right-to-left, or bottom-to- top, drawing. (corresponds to the dot option 'rankdir'
  • max_subclass_depth: The maximum depth to which subclasses will be drawn.
  • max_subclasses: A list of ints, specifying how many subclasses should be drawn per class at each level of the graph. E.g., [5,3,1] means draw up to 5 subclasses for the specified classes; up to 3 subsubclasses for each of those (up to) 5 subclasses; and up to 1 subclass for each of those.
  • max_attributes
  • max_operations
  • show_private_vars
  • show_magic_vars
  • link_attributes
  • show_signature_defaults
  • max_signature_width

call_graph(api_docs, docindex, linker, context=None, **options)

source code 
Parameters:
  • options -
    • dir: rankdir for the graph. (default=LR)
    • add_callers: also include callers for any of the routines in api_docs. (default=False)
    • add_callees: also include callees for any of the routines in api_docs. (default=False)

To Do: Add an exclude option?

add_valdoc_nodes(graph, val_docs, linker, context)

source code 
call graph 

To Do: Use different node styles for different subclasses of APIDoc


Variables Details [hide private]

COLOR

colors for graphs of APIDocs
Value:
{'BASECLASS_BG': '#e0b0a0',
 'CLASS_BG': '#d8ffe8',
 'INH_LINK': '#800000',
 'MODULE_BG': '#d8e8ff',
 'ROUTINE_BG': '#e8d0b0',
 'SELECTED_BG': '#ffd0d0',
 'SUBCLASS_BG': '#e0b0a0',
 'UNDOCUMENTED_BG': '#c0c0c0'}

MODULE_NODE_HTML

Value:
'''<TABLE BORDER="0" CELLBORDER="0" CELLSPACING="0"
         CELLPADDING="0" PORT="table" ALIGN="LEFT">
  <TR><TD ALIGN="LEFT" VALIGN="BOTTOM" HEIGHT="8" WIDTH="16" FIXEDSIZE\
="true"
          BGCOLOR="%s" BORDER="1" PORT="tab"></TD></TR>
  <TR><TD ALIGN="LEFT" VALIGN="TOP" BGCOLOR="%s" BORDER="1"
          PORT="body" HREF="%s" TOOLTIP="%s">%s</TD></TR>
  </TABLE>'''